


These stocks will double profits soon
But has the market already priced that in?

If you can follow only one bit of data, follow the earnings.
If I had to pick one key lesson from Peter Lynch, this would be the one.
So, if that is true…
Which companies are supposed to at least double their earnings in less 3 years?
But most importantly, the big question is:
Has the market already priced-in the news?
Today, I’m bringing you inside my research to briefly highlight 5 popular names.
A simple screening idea
A 100% in EPS in less than 3 years equals to a 26% CAGR in EPS.
But since I’m a fan of profitable growth, I added a +15% CAGR in Sales as well.
And the screener is made:
EPS (GAAP) Forward 3Y CAGR > 26%
Revenue Forward 3Y CAGR > 15%
Market Cap > $1B
Country: US
Finchat’s data is directly linked to analysts’ estimates.
And that might be a big limitation.
I almost never rely on these estimates, as they’re typically lagging.
However, they can be useful to gauge the overall market’s expectations, which is exactly the goal for today’s idea.
Let’s dive in.
How to read the upcoming charts?
It’s pretty simple.
I built these projetions by feeding internal financial modeling automations with:
EPS and Sales CAGR, as per Finchat.io
A range of End Multiples - intended as Forward P/E at the end of the period
With only one element of additional complexity.
I extended these estimates for 2 more years, to see what happens if the trend continues up until my ideal time-frame → 5 years.
Adn you’ll see how extending the time frame can change the perspective.
Now let the charts do the talking!
5. Duolingo - DUOL
🚀 3-year Sales CAGR = 28.8%
💸 3-year EPS GAAP CAGR = 50.5%
🥧 Market Cap = $22.1B
🔥 End Multiple Scenario Assumptions: 23x, 33x, 42x EPS
Projections:
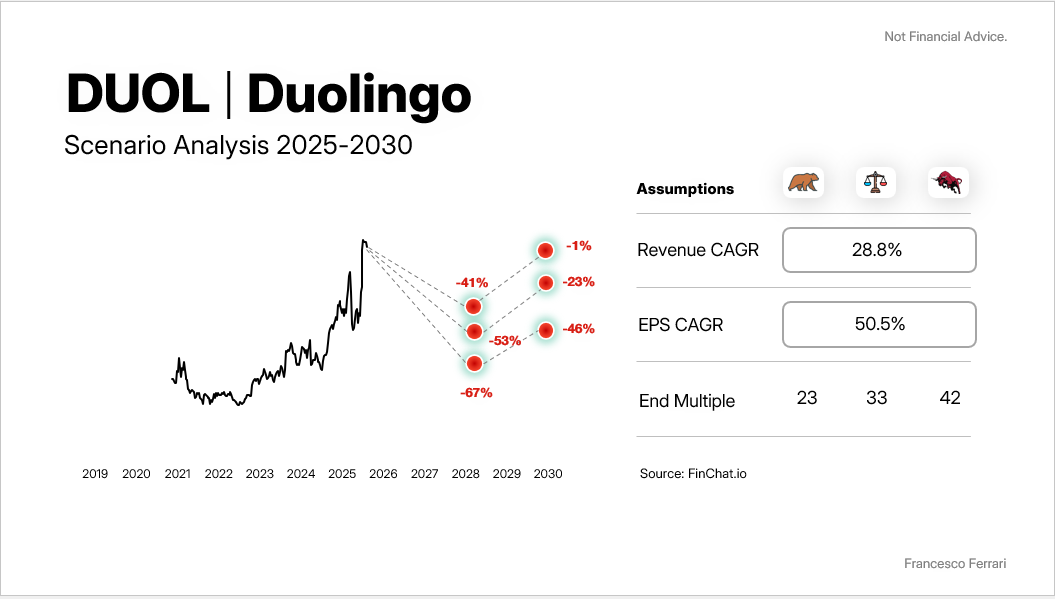
Analysts’ estimate carry an end-of-period implied Net Profit Margin of → 18%.
Which is somewhere in between current Free Cash Flow Margin (above 35%!) and Net Profit Margin.
So the question that should immediately come natural is:
Is the market actually valuing DUOL on GAAP EPS or Free Cash Flow?

I’m leaving the answer to you.
4. ServiceNow - NOW
🚀 3-year Sales CAGR = 19.0%
💸 3-year EPS GAAP CAGR = 27.3%
🥧 Market Cap = $209.4B
🔥 End Multiple Scenario Assumptions: 30x, 40x, 50x EPS (extremely generous)
Projections:

This implies an end-of-period Net Profit Margin of → 16.4%.
The situation might seem terrible here as well.
However, as with DUOL, ServiceNow has been producing FCF above 30% for years now.

So what’s the market actually considering when dealing with this type of companies?
Food for thought.
3. Eli Lilly And Company - LLY
🚀 3-year Sales CAGR = 22.8%
💸 3-year EPS GAAP CAGR = 42.9%
🥧 Market Cap = $724.6B
🔥 End Multiple Scenario Assumptions: 20x, 28x, 36x EPS
Projections:

This implies an end-of-period Net Profit Margin of → 23.7%.
In line with recent trends.

Essentially, your performance on LLY will significantly depend on the market sentiment.
Meaning - EPS expectations are fully priced-in, and the stock can keep running only if the market wants to (by keep paying a premium for it).
Slippery floor to play on.
2. Palantir - PLTR
🚀 3-year Sales CAGR = 32.0%
💸 3-year EPS GAAP CAGR = 49.7%
🥧 Market Cap = $313.4B
🔥 End Multiple Scenario Assumptions: 30x, 45x, 60x EPS (extremely generous)
Projections:

Once again, the implied Net Profit Margin of PLTR if this were true is → 26.8%.
This comes way below the most recent developments in FCF, breaking 40%.

Much has been said on PLTR.
Is it priced for perfection? For sure.
The only thing that could save PLTR from a couple of years of stagnation is a terrific reacceleration of revenues at a pace that only NVDA has been able to execute.
Can PLTR start growing at a 70%, 80%, 100% clip?
1. e.l.f. Beauty - ELF
🚀 3-year Sales CAGR = 15.1%
💸 3-year EPS GAAP CAGR = 33.9%
🥧 Market Cap = $6.6B
🔥 End Multiple Scenario Assumptions: 15x, 25x, 35x EPS
Projections:

The implied Net Profit Margin of ELFif this were true is → 13.5%.
Therefore, the market is expecting scalability and/or efficiency from Management.
It’s in fact pricing in record EPS for the company, a level that’s never been hit so far.

With the benefit of hindsight, the most recent bottom might have been a nice entry point.
For sure, this is the company in this group with the least amount of expectations already priced-in - and the lowest sentiment.
Replacing EPS with FCF/share, the picture changes
Conclusion: something might be off with GAAP EPS.
For the sake of this excercise, we always plugged in EPS growth in our model.
Yet as anticipated above, when FCF is dramatically higher than accounting earnings, the market may be using the latter to value high growth companies.
That’s because FCF in this case will likely become the role of a leading indicator.
At some point, EPS will catch up to FCF.
And it’s likely going to be late for old-school value investors.
This is what happened to me a few years back and what I keep seeing happening in the market.
In an era where investments in intangibles dominate over tangibles, it may make more sense to look at cash flow metrics.
As GAAP EPS tend to be biased down by the innovative effort of these world-changing companies.
This is how I can help you:
If you’re an ambitious professional who’s looking to diversify into equities and potentially leverage modern value investing as your n.1 wealth engine:
You can find all the details in this video 👇🏼 (link here)

➡️ Click here to watch the explainer video
You’ll discover:
if this is for you, or not
what qualifies me, my background, and returns
the structure of the Program
Financial Statements Masterclass - [Waitlist & Early Access]
As anticipated, I am preparing a self-paced masterclass on how to read through financial statements with the eye of an investor.
Thanks to all of you who already joined the waitlist!
👇🏼
➡️ Have a look here - early access is open!
📈
Thank you again for your valuable time.
Happy Investing!
Francesco
Palantir, yikes!